It’s always exciting to see what folks in the Cloud Native community think the first time they encounter Linkerd. In this video, Lachlan Evenson, a Principal Program Manager at Microsoft Azure Container Services and CNCF Ambassador, takes a super extensive tour of Linkerd 2.0. His under-the-hood perambulations include: running health checks to ensure that Linkerd has installed correctly, tracking resource consumption and CRD counts (hint: 0) in the install process, and extensive looks at Linkerd’s UNIX-style CLI, including ‘stat’, ‘tap’ and ‘top’ commands to track service behaviors like inbound and outbound request performance.
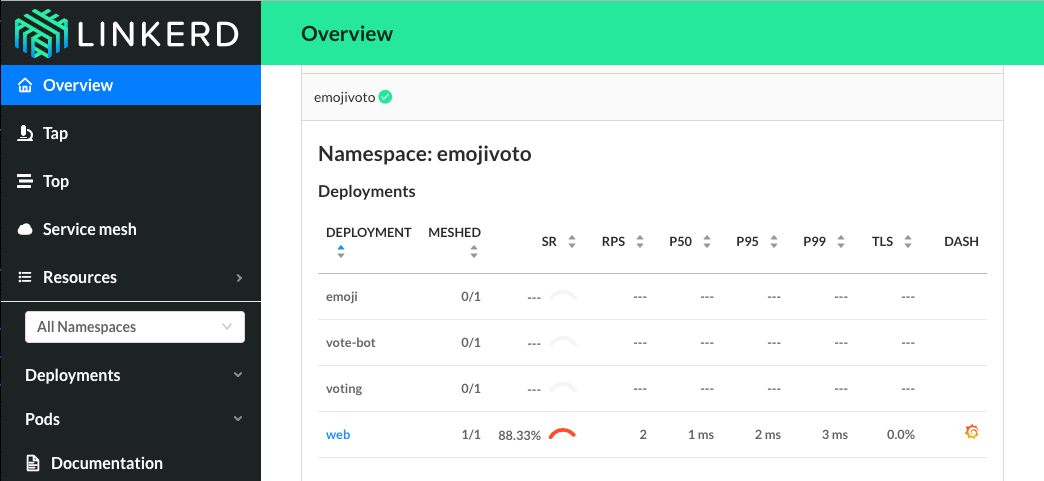
Lachie installs an Golang app with broken service in an Azure Kubernetes environment and then does some nifty live debugging the demo app. In the Linkerd 2.0 dashboard UX, he looks at service topologies and then checks out different views of service behaviors to find failing services and identify the source of the failures.
Here’s what he had to say about the experience:
“Just by simply running inject and putting the sidecar in place, I had visibility without any config or code changes into where my apps was broken and then could go and fix it. This must be incredibly liberating and powerful to get this at a glance and drill down into tap and top to see what each of the data sources are hitting”
If you want to try out Linkerd 2.0 and follow along with Lachie, you also download the demo app he uses to debug and code alongside.


