Conduit is now part of Linkerd! Read more >
This post was coauthored by Frederic Branczyk, a member of the Prometheus team.
Conduit is an open source service mesh for Kubernetes. One of its features is a full telemetry pipeline, built on Prometheus, that automatically captures service success rates, latency distributions, request volumes, and much more.
In the 0.4.0 release, in collaboration with Frederic Branczyk, a member of the upstream Prometheus team, we rewrote this pipeline from the ground up. This post shares some of the lessons we learned about Prometheus along the way.
Telemetry pipeline: a first pass
Conduit aims to provide top-line service metrics without requiring any configuration or code changes. No matter what your Kubernetes application does or what language it’s written in, Conduit should expose critical service metrics like success rates without any effort on your part. To do this, Conduit instruments all traffic as it passes through the Conduit proxies, aggregates this telemetry information, and reports the results. This is known as the “telemetry pipeline,” and Prometheus is a central component.
When we released Conduit 0.2.0 in January, it included a first pass at user-visible telemetry. In this initial iteration, Conduit was extremely liberal in how it recorded metrics, storing histograms for every possible combination of request metadata (including paths, etc), and exposing this information at extremely small time granularities (down to the second).
In order to do this without incurring latency or significant memory consumption in the proxy, we maintained a fixed-sized buffer of events, which the proxy periodically sent to the control plane to be processed. The control plane aggregated these events, using the Kubernetes API to discover interesting source and destination labels, and in turn exposed these detailed metrics to be scraped by Prometheus. Conduit’s control plane contained a dedicated service, called Telemetry, that exposed an API with distinct read and write paths.

Writes
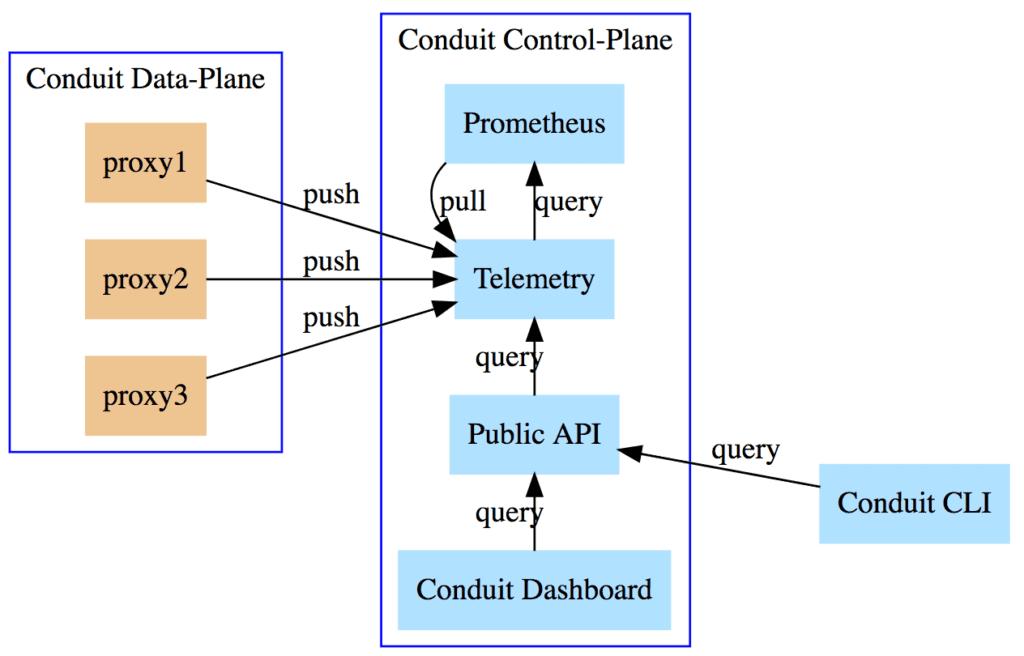
In this initial version, proxies pushed metrics via a gRPC write interface provided by the Telemetry service. The overall telemetry flow was:
- The Conduit proxies (one in each Kubernetes Pod) push metrics to our Telemetry service via a gRPC interface.
- The Telemetry service aggregates data from each proxy.
- The Telemetry service exposes this aggregated data on a
/metricsendpoint. - Prometheus collects from the Telemetry service’s
/metricsendpoint.
Here is just a small snippet of that gRPC write interface:
message ReportRequest {
  Process process = 1;
  enum Proxy {
    INBOUND = 0;
    OUTBOUND = 1;
  }
  Proxy proxy = 2;
  repeated ServerTransport server_transports = 3;
  repeated ClientTransport client_transports = 4;
  repeated RequestScope requests = 5;
}
message Process {
  string node = 1;
  string scheduled_instance = 2;
  string scheduled_namespace = 3;
}
message ServerTransport {
  common.IPAddress source_ip = 1;
  uint32 connects = 2;
  repeated TransportSummary disconnects = 3;
  common.Protocol protocol = 4;
}
...
Reads
Similarly, the initial read path used a gRPC read interface for the Public API to query the Telemetry service, and followed a comparable flow:
- Public API service queries Telemetry for metrics via gRPC.
- Telemetry service queries Prometheus.
- Telemetry service repackages the data from Prometheus.
- Telemetry service returns repackaged data to the Public API.
A collaboration
When we announced the Conduit 0.2.0 release on Twitter, it resulted in this seemingly innocuous reply:
Frederic helped us identify a number of issues in the telemetry pipeline we had designed:Are any of you at fosdem over the weekend? I would love to chat about your @PrometheusIO story!
— Frederic 🧊 Branczyk @brancz@hachyderm.io (@fredbrancz) February 1, 2018
- The push model required the Telemetry service to hold and aggregate a lot of state that was already present in all the proxies.
- Recency of data was inconsistent due to timing difference between proxy push intervals and Prometheus collection intervals.
- Though the Telemetry service appeared as a single collection target to Prometheus, we were essentially simulating a group of proxies by overloading metric labels.
- It was challenging to iterate, modify, and add new metric types. The read and write gRPC interfaces were acting as inflexible wrappers around an established Prometheus metrics format and query language.
In addition, Conduit had re-implemented a lot of functionality that was already provided by Prometheus, and didn’t take advantage of some functionality it should have:
- Prometheus operates with pull model.
- Prometheus already has excellent Kubernetes service discovery support.
- Prometheus has a flexible and powerful query language.
Telemetry pipeline: doin’ it right
With Frederic’s pointers in mind, we set about stripping away any functionality in Conduit that could be offloaded onto Prometheus. The most obvious component for removal was the Telemetry service itself, which was aggregating data across proxies on the write side, and serving metrics queries on the read side: two things Prometheus could already do itself.
Removal of the Telemetry service meant that the proxies needed to serve a /metrics endpoint that Prometheus could collect from. To populate this, we developed a metrics recording and serving module specific to our Rust proxy. On the read side, we then needed to wire up the Public API directly to Prometheus. Fortunately much of that integration code already existed in the Telemetry service, so we simply moved that Prometheus client code into the Public API.
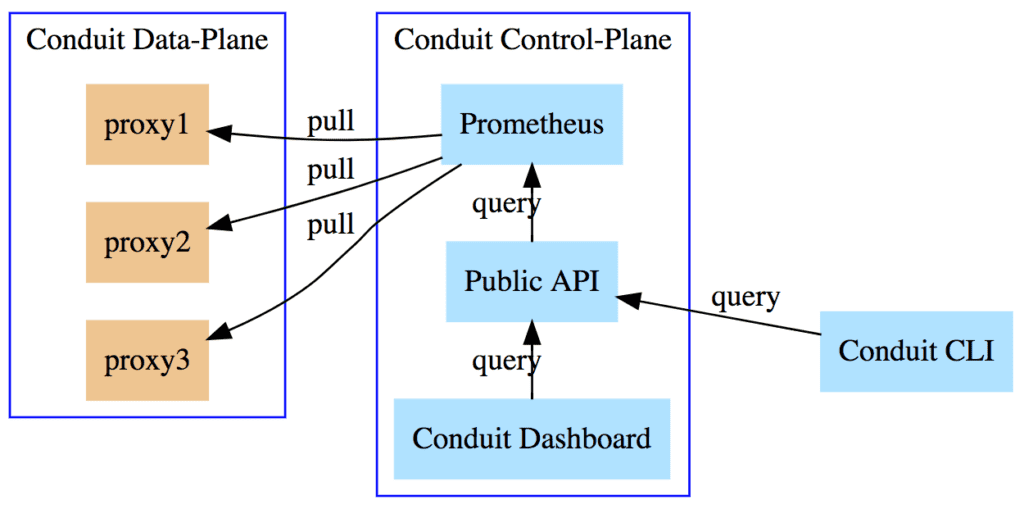
These changes allowed us to delete our gRPC read and write APIs, and yielded a much simpler and more flexible architecture:

The new telemetry pipelines were significantly easier to reason about:
Write pipeline
- Rust proxies serve a
/metricsendpoint. - Prometheus pulls from each proxy, discovered via Kubernetes service discovery.
Read pipeline
- Public API queries Prometheus for metrics.
We released the redesigned metrics pipeline with Conduit 0.4.0, and there was much rejoicing.
“The proxy no longer pushes
— Frederic 🧊 Branczyk @brancz@hachyderm.io (@fredbrancz) April 17, 2018
metrics to the control plane.”
I could not be happier about this! I’m really enjoying the development of @runconduit! https://t.co/RHZr4u29uH
Plus some cool new features
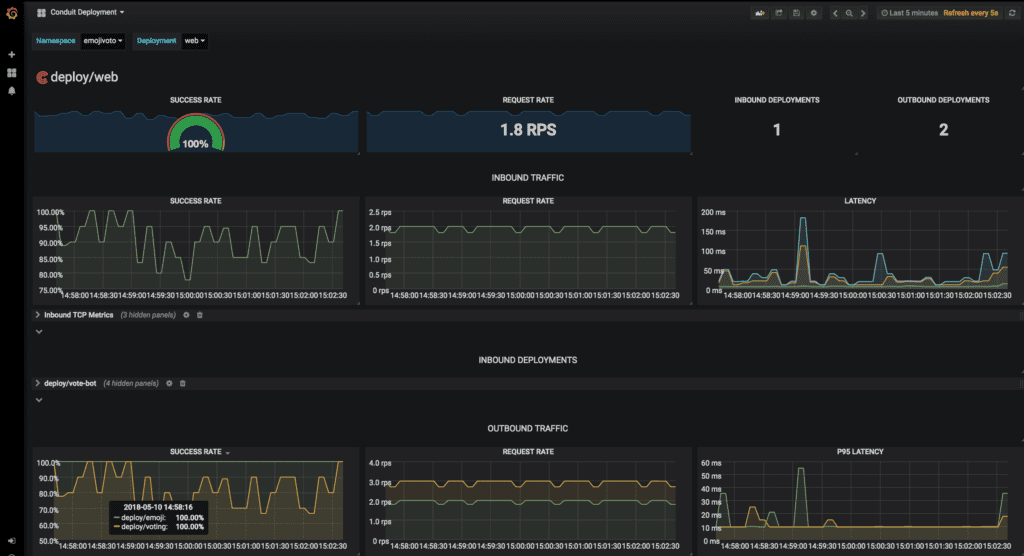
The new telemetry pipeline also unlocked a number of notable cool new features, including advancements to the conduit stat command and an easy Grafana integration:
$ conduit -n emojivoto stat deploy
NAME       MESHED   SUCCESS      RPS   LATENCY_P50   LATENCY_P95   LATENCY_P99
emoji         1/1   100.00%   2.0rps           5ms          10ms          10ms
vote-bot      1/1         -        -             -             -             -
voting        1/1    87.72%   0.9rps           6ms          16ms          19ms
web           1/1    93.91%   1.9rps           8ms          41ms          48ms
Looking ahead
Of course, there’s still a lot more work to do on the Conduit service mesh and its telemetry system, including:
- Leveraging kube-state-metrics for more complete Kubernetes resource information.
- Leveraging Kubernetes Mixins for more flexible generation of Grafana dashboards.
- Immediate expiration of metrics in the proxy when Kubernetes services go away, in order to make appropriate use of Prometheus’ staleness handling.
- Long-term metrics storage.
We hope you enjoyed this summary of how and why we rewrote Conduit’s telemetry pipeline to better make use of Prometheus. What to try the results for yourself? Follow the Conduit quickstart and get service metrics on any Kubernetes 1.8+ app in about 60 seconds.
If you like this sort of thing, please come get involved! Conduit is open source, everything is up on the GitHub repo, and we love new contributors. Hop into the conduit-users, conduit-dev, and conduit-announce mailing lists, the #conduit Slack channel, and take a look at the issues marked “help wanted”. For more details on upcoming Conduit releases, check out our Public Roadmap.


