Conduit is now part of Linkerd! Read more >
Earlier this week, we released Conduit v0.4.0. This release has some significant improvements to the Prometheus-based telemetry system, and introduces some incredibly cool new tools for debugging microservices.
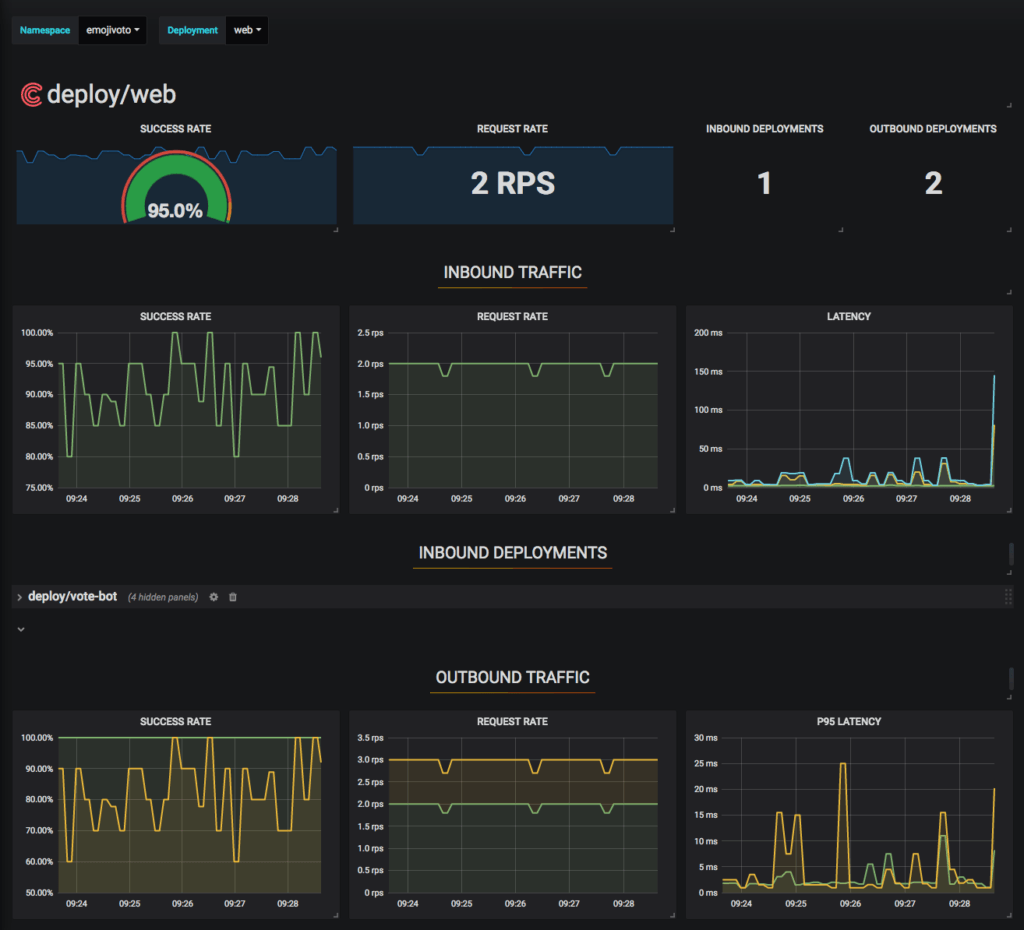
Within 60 seconds from installation, Conduit now gives you preconfigured Grafana dashboards for every Kubernetes Deployment. These dashboards not only cover top-line metrics such as success rate, request volume, and latency distributions per service, they break these metrics down per dependency. This means you can easily answer questions like “where is the traffic for this service coming from?” and “what’s the success rate of Foo when it’s calling Bar?”, without having to change anything in your application.

Dude, where’s my traffic?
Some of the most critical questions to answer in a microservices app are around the runtime dependencies between services. It’s one thing to have success rate per service; it’s quite another to understand where traffic to a service is coming from, and which dependencies of a service are exhibiting failures. Typically, these questions are also the hardest to answer as well. But we knew we had an opportunity to make it easy with Conduit.
To accomplish this, in 0.4.0, we moved Conduit’s telemetry system to a completely pull-based (rather than push-based) model for metrics collection. As part of this, we also modified Conduit’s Rust proxy to expose granular metrics describing the source, destination, and health of all requests. A pull-based approach reduces complexity in the proxy, and fits better into the model of the world that Prometheus expects.
As a result, Conduit’s telemetry system is now incredibly flexible. You can dive into request rate, success rate, and latency metrics between any two Kubernetes deployments, pods, or namespaces. You can write arbitrary Prometheus queries on the result. And, of course, we wire everything through to the CLI as well. “Top” for microservices, anyone?

How it works in practice
Let’s walk through a brief example. (For a full set of installation instructions, see the official Conduit Getting Started Guide.)
First, install the Conduit CLI:
curl https://run.conduit.io/install | shNext, install Conduit onto your Kubernetes cluster:
conduit install | kubectl apply -f -Finally, install the “emojivoto” demo app, and add it to the Conduit mesh:
curl https://raw.githubusercontent.com/runconduit/conduit-examples/master/emojivoto/emojivoto.yml | conduit inject - | kubectl apply -f -The demo app includes a vote-bot service that is constantly running traffic through the system. This AI-based bot is voting on its favorite emojis and is designed to slowly become more intelligent, and more cunning, over time. For safety reasons, we recommend you don’t let it run for more than a few days. ;-) Let’s see how we can use Conduit to understand how traffic is flowing through the demo app. Start by seeing how the web service (technically, web Deployment) is doing:
$ conduit stat -n emojivoto deployment web
NAME  MESHED  SUCCESS     RPS    LATENCY_P50  LATENCY_P95  LATENCY_P99
web      1/1   90.00%  2.0rps            2ms          4ms          9ms
The success rate of requests is only 90%. There’s a problem here. But is it possible this is an upstream failure? We can find out looking at the success rate of the services our `web` deployment talks to.
$ conduit stat deploy --all-namespaces --from web --from-namespace emojivoto
NAMESPACE   NAME   MESHED   SUCCESS      RPS   LATENCY_P50  LATENCY_P95   LATENCY_P99
emojivoto   emoji     1/1   100.00%   2.0rps           1ms          2ms           2ms
emojivoto   voting    1/1    72.88%   1.0rps           1ms          1ms           1ms
Here you see that web talks to both the emoji and the voting services. The success rate of the calls to emoji is 100%, but to voting its only 72.88%. Note that this command is displaying the success rate only from web to emoji, and only from web to voting. The aggregate success rate of the emoji and voting services might be different. With just a bit of digging, we’ve determined that the culprit is probably the voting service. Who else talks to the voting service? To find out, we can run the following command:
$ conduit stat deploy --to voting --to-namespace emojivoto --all-namespaces
NAMESPACE   NAME MESHED   SUCCESS      RPS   LATENCY_P50   LATENCY_P95   LATENCY_P99
emojivoto    web    1/1    83.33%   1.0rps           1ms           2ms           2ms
The voting service is only called from the web service. So, by tracing dependencies from web, we now have a plausible target for our first investigation: the voting service is returning a 83% success rate when web is calling it. From here, we might look into the logs, traces, or other forms of deeper investigation into this service.

That’s just a sample of some of the things you can do with Conduit. If you want to dive deeper, try looking at the success rate across all namespaces; success rate for a single namespace, broken down by deployments across all namespaces that call into that namespace; or success rate of Conduit components themselves. The possibilities are endless (kinda)! We’ve also recorded a brief demo so you can see this in action.
What’s next?
In terms of metrics and telemetry, we’ll be extending these semantics to other Kubernetes objects, such as Pods and ReplicaSets in upcoming releases. We’ll also be making `conduit tap` work on these same objects, since `tap` and `stat` work beautifully together. We might also just have another fun command or two waiting in the wings, ready to show off the power of Conduit’s new telemetry pipeline. Stay tuned!
Special thanks to Frederic Branczyk for invaluable Prometheus help.


