In this part of our series, we’re going to begin focusing on how the various features of a service mesh are implemented in practice.
This is one article in a series of articles covering service mesh technology. Other installments in this series include:
- The problem we’re solving
- Making service requests visible (this article)
- Adding a layer of resilience
- Security and implementation
- Customer use cases
- Future state & where the technology is going
In the first installment of this series, we covered why a service mesh exists and what problems it solves. In the next few followup posts, we’ll explore how the service mesh is implemented in practice to highlight why specific concepts matter in the context of solving those problems.
In this article, we look at how the service mesh introduces previously missing observability.
Making service traffic behavior visible
The explicit goal of the service mesh is to move service communication out of the realm of invisible and implied infrastructure into the realm of first-class citizenship–where it can be monitored, controlled, and managed.
Service communication has operated in the shadows, living in a blindspot enabled by the relative uniformity and predictability of traffic within monolithic applications. The shift to microservices makes living with that blindness unsustainable. When service-to-service communication becomes the default, it needs to be reliable. Cloud-native computing principles aim to run applications reliably on top of unreliable infrastructure: the underlying components can and will fail. When those failures occur, it should be easy to determine the cause and react appropriately.
When running microservices in production, it’s not always clear where requests are coming from or where they’re going to. A plethora of data sources exist and their relationships are rarely defined and clear. Troubleshooting production service issues shouldn’t be an exercise in triaging observations from multiple sources and guesswork. What we need are tools that reduce that cognitive burden, not increase it.
The first thing users typically get out of using a service mesh is observability where it previously didn’t exist: in the service communication layer. The service mesh helps developers and operators understand the distributed traffic flow of their applications.
Where observability occurs
You’ll recall the earlier distinction of the separate components in a service mesh: the data plane and control plane. To summarize, the data plane touches every packet/request transmitted between services and it exposes primitives to specify desired behavior for things like service discovery, routing, retries, etc. The control plane is where you, as an operator, use those primitives to specify policy and configuration that informs how the data plane behaves.
Some service mesh implementations pair separate products, like using Envoy (a data plane) with Istio (a control plane). Some service mesh implementations, like Linkerd, contain both a data plane and a control plane in one product. Confusingly for new users, those distinctions aren’t always clear since you can do things like take the data plane portion of Linkerd and integrate it with Istio. There’s more detail around those implementations that we’ll cover later. For now, the takeaway is that every service mesh solution needs both of these components.
The data plane is not just where the data of service-to-service communication is exchanged, it’s also where telemetry data around that action is gathered. The service mesh gathers descriptive data about what it’s doing to provide observability at the wire level. Exactly which data is gathered varies between service mesh implementations. Generally you can expect to find top-line service metrics.
Top-line service metrics are the measures you care about because they directly affect the business. It’s helpful to record bottom-line metrics like CPU and memory usage to triage events, but what should be triggering alerts are measures like a significant drop in success rates. In other words, while some metrics are useful for debugging, having anomalies in them isn’t what you want to be woken up about at 4am. The data plane is designed to observe measures like latency, request volume, response time, success/failure/retry counts, error types, load balancing statistics, and more: metrics that indicate services are unavailable.
The data plane can then be polled by external metrics-collection utilities for aggregation. In some implementations, the control plane may act as an intermediary aggregator by collecting and processing that data before sending it to backends like Prometheus, InfluxDB, or statsd. That data can then be presented in any number of ways, including the popular choice of displaying it via dashboards using Grafana.
Where you notice observability
Dashboards help you visualize trends when troubleshooting by presenting aggregated data in easily digestible ways. Their presence is handy when using a service mesh, so they’re often included as an implementation component. But that can also be confusing to new users. Where does the dashboarding backend fit into service mesh architecture?
Envoy is a data plane and it supports using Grafana. Istio is a control plane and it supports using Grafana. And Linkerd, which is both a data plane and a control plane, also supports using Grafana. Are dashboards part of the data plane or the control plane?
The truth is, they’re not strictly a part of either.
When you (as a human) interact with a service mesh, you typically interact with the control plane. Because dashboards help humans digest aggregated data more easily, it makes contextual sense for them to sit next to where you interact with the system. For example, Istio includes that backend as the Istio dashboard add-on component, Linkerd includes that as the linkerd-viz add-on, and (in the earlier example) Envoy presumes you already have you own metrics-collection backend and dashboards set up somewhere else.
Make no mistake, any dashboard no matter where it’s implemented is reading data that was observed in the data plane. That’s where observability occurs, even if you notice the results somewhere else.
Beyond service metrics
The service mesh provides visibility in new ways by presenting detailed histograms and metrics that give you a consistent and global view of application performance. Those metrics are available in both machine-parsable and human-readable formats. But beyond service health metrics, the service mesh also provides another useful layer of visibility.
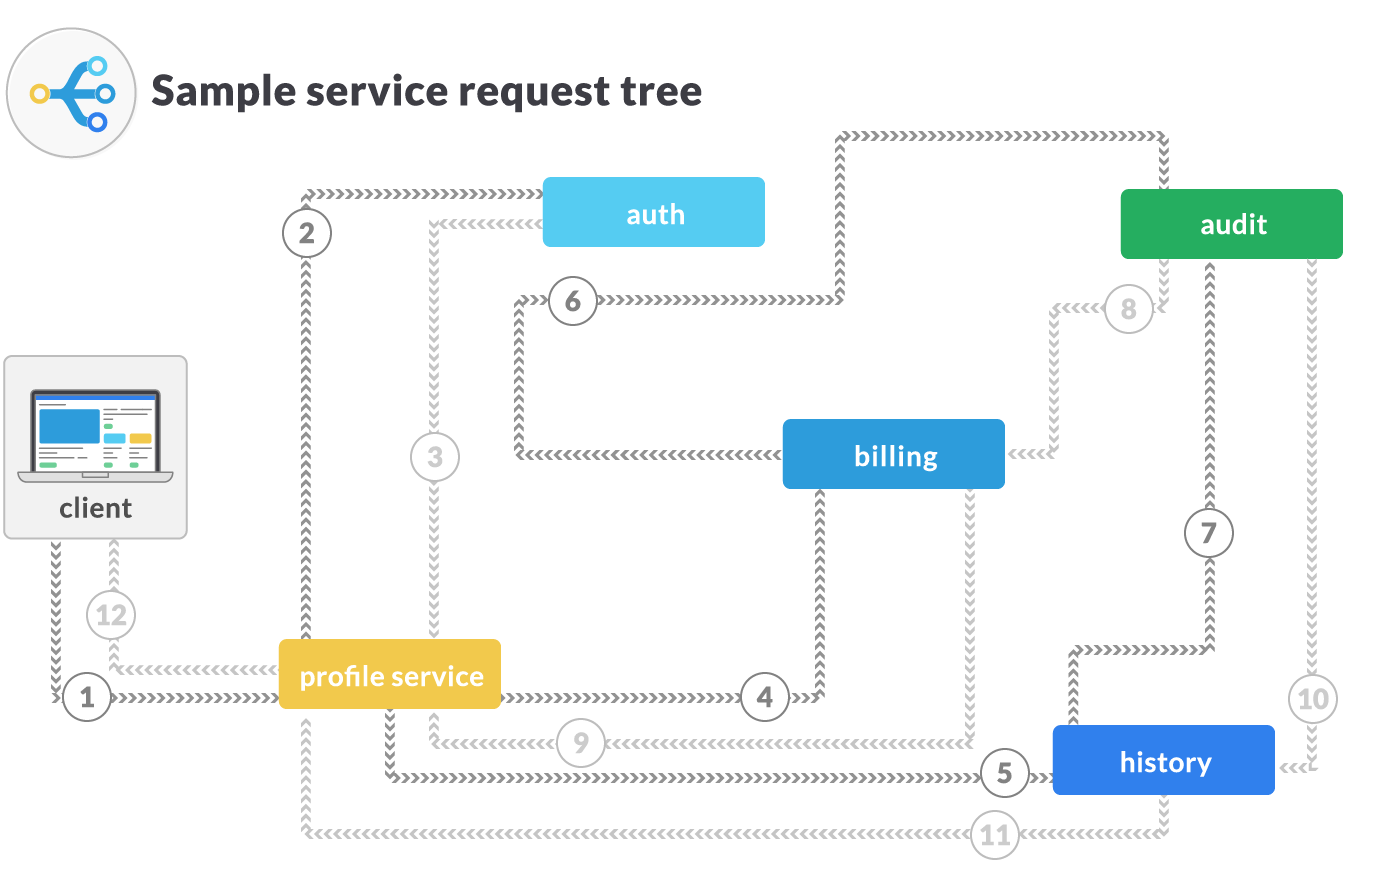
Service communication can often span multiple endpoints. For example, a seemingly simple request to a profile service may require child requests to other services like auth, billing, and additional resources to fulfill. Those services may also have their own additional requests to make in order to fulfill the parent request.

If a request to any of the underlying services fails, the client only knows that its request to the profile service failed, but not where or why. External monitoring only exposes overall response time and (maybe) retries, but not individual internal operations. Those operations may be scattered across numerous logs, but a user interacting with the system may not even know where to look. In the above example, if there’s an intermittent problem with the audit service, there’s no easy way to tie that back to failures seen via the profile service unless an operator has clear knowledge of how the entire service tree operates.
Distributed tracing helps developers and operators understand the behavior of any application inside the service mesh. Requests routed by the data plane can be configured to trace every step (or “span”) they take when attempting to fulfill successfully. In other words, a trace is comprised of spans where each span corresponds to a service invoked by a request.
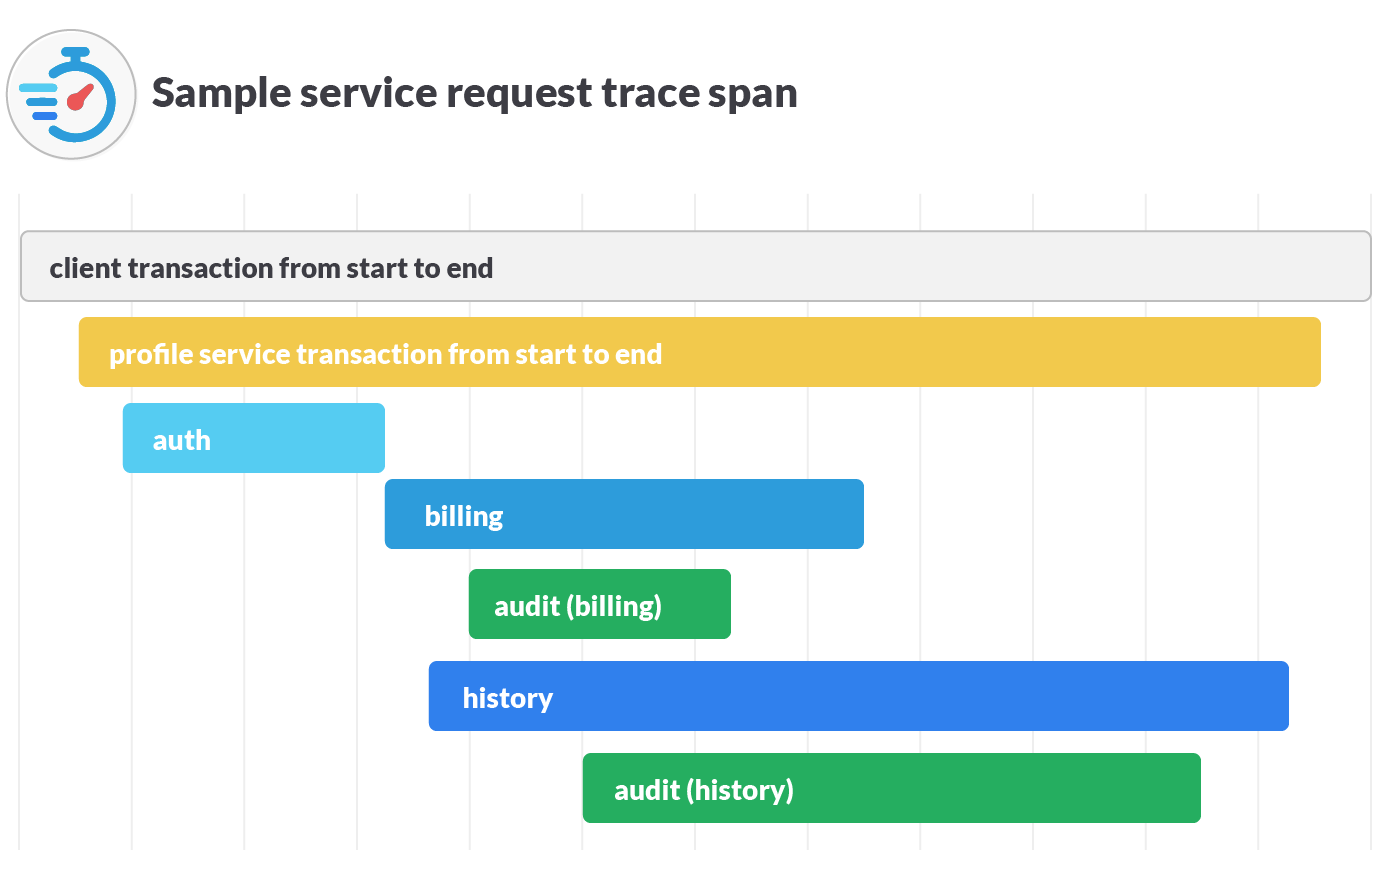
The visualization above shows how these microservices fit together. But it doesn’t show time durations, parallelism, or dependent relationships. There’s also no way to easily show latency or other aspects of timing. A full trace span allows you to instead visualize every step required to fulfill a service request by correlating them in a manner like this:

Each span corresponds to a service invoked during the execution of our request. Because the service mesh data plane proxies the calls to each underlying service, it’s already gathering data about each individual span like source, destination, latency, and response code. Without pre-requisite knowledge of the entire system, you can then more easily determine the exact source of any present issues.
While the service mesh is in a position to easily provide instrumentation and produce data about individual spans, you still need another system–like Zipkin, OpenTracing, or Jaeger–to collect them and assemble the full trace. The specifics of how that trace span is assembled depends on the underlying implementation, which varies between different service mesh data planes.
While the hooks exist to capture this data, you should note that application code changes are required in order to use this functionality. Your apps need to propagate and forward the required HTTP headers so that when the data plane sends span information to the underlying telemetry, the spans can be untangled and correlated back into a contiguous single trace.
Visibility by default
Without any extra work, just by deploying the service mesh you get immediate out-of-the-box visibility of health metrics. More detailed granularity to clearly see otherwise obscured steps performed by each request can be achieved by making the small header modifications required to use distributed tracing. For now, that covers core visibility concepts. Later in the series, we’ll dive further into details when we look at customer specific use cases.
Visibility for managing services is critical, but it’s also not enough. Your services also need resiliency. In the next installment of this series, we’ll explore how to use the primitives within a service mesh to improve your application’s resiliency.


