Linkerd’s role as a *service mesh* makes it a great source of data around system performance and runtime behavior. This is especially true in polyglot or heterogeneous environments, where instrumenting each language or framework can be quite difficult. Rather than instrumenting each of your apps directly, the service mesh can provide a uniform, standard layer of application tracing and metrics data, which can be collected by systems like Zipkin and Prometheus.
In this post we’ll walk through a simple example how Linkerd and Zipkin can work together in Kubernetes to automatically get distributed traces, with only minor changes to the application. This is one article in a series of articles about Linkerd, Kubernetes, and service meshes. Other installments in this series include:
- Top-line service metrics
- Pods are great, until they’re not
- Encrypting all the things
- Continuous deployment via traffic shifting
- Dogfood environments, ingress, and edge routing
- Staging microservices without the tears
- Distributed tracing made easy (this article)
- Linkerd as an ingress controller
- gRPC for fun and profit
- The Service Mesh API
- Egress
- Retry budgets, deadline propagation, and failing gracefully
- Autoscaling by top-line metrics
In previous installments of this series, we’ve shown you how you can use Linkerd to [capture top-line service metrics][part-i]. Service metrics are vital for determining the health of individual services, but they don’t capture the way that multiple services work (or don’t work!) together to serve requests. To see a bigger picture of system-level performance, we need to turn to distributed tracing.
In a previous post, we covered some of the [benefits of distributed tracing][polyglot], and how to configure Linkerd to export tracing data to Zipkin. In this post, we’ll show you how to run this setup entirely in Kubernetes, including Zipkin itself, and how to derive meaningful data from traces that are exported by Linkerd.
A Kubernetes Service Mesh
Before we start looking at traces, we’ll need to deploy Linkerd and Zipkin to Kubernetes, along with some sample apps. The linkerd-examples repo provides all of the configuration files that we’ll need to get tracing working end-to-end in Kubernetes. We’ll walk you through the steps below.
STEP 1: INSTALL ZIPKIN
We’ll start by installing Zipkin, which will be used to collect and display tracing data. In this example, for convenience, we’ll use Zipkin’s in-memory store. (If you plan to run Zipkin in production, you’ll want to switch to using one of its persistent backends.) To install Zipkin in the default Kubernetes namespace, run:
kubectl apply -f https://raw.githubusercontent.com/linkerd/linkerd-examples/master/k8s-daemonset/k8s/zipkin.ymlYou can confirm that installation was successful by viewing Zipkin’s web UI:
ZIPKIN_LB=$(kubectl get svc zipkin -o jsonpath="{.status.loadBalancer.ingress[0].*}")
open http://$ZIPKIN_LB # on OS X
Note that it may take a few minutes for the ingress IP to become available. Or if external load balancer support is unavailable for the cluster, use hostIP:
ZIPKIN_LB=$(kubectl get po -l app=zipkin -o jsonpath="{.items[0].status.hostIP}"):$(kubectl get svc zipkin -o 'jsonpath={.spec.ports[0].nodePort}')
open http://$ZIPKIN_LB # on OS X
However, the web UI won’t show any traces until we install Linkerd.
STEP 2: INSTALL THE SERVICE MESH
Next we’ll install the Linkerd service mesh, configured to write tracing data to Zipkin. To install Linkerd as a DaemonSet (i.e., one instance per host) in the default Kubernetes namespace, run:
kubectl apply -f https://raw.githubusercontent.com/linkerd/linkerd-examples/master/k8s-daemonset/k8s/linkerd-zipkin.ymlThis installed Linkerd as a service mesh, exporting tracing data with Linkerd’s Zipkin telemeter. The relevant config snippet is:
telemetry:
- kind: io.l5d.zipkin
    host: zipkin-collector.default.svc.cluster.local
    port: 9410
    sampleRate: 1.0
Here we’re telling Linkerd to send tracing data to the Zipkin service that we deployed in the previous step, on port 9410. The configuration also specifies a sample rate, which determines the number of requests that are traced. In this example we’re tracing all requests, but in a production setting you may want to set the rate to be much lower (the default is 0.001, or 0.1% of all requests).
You can confirm the installation was successful by viewing Linkerd’s admin UI (note, again, that it may take a few minutes for the ingress IP to become available, depending on the vagaries of your cloud provider):
L5D_INGRESS_LB=$(kubectl get svc l5d -o jsonpath="{.status.loadBalancer.ingress[0].*}")
open http://$L5D_INGRESS_LB:9990 # on OS X
Or if external load balancer support is unavailable for the cluster, use hostIP:
L5D_INGRESS_LB=$(kubectl get po -l app=l5d -o jsonpath="{.items[0].status.hostIP}")
open http://$L5D_INGRESS_LB:$(kubectl get svc l5d -o 'jsonpath={.spec.ports[2].nodePort}') # on OS X
STEP 3: INSTALL THE SAMPLE APPS
Now we’ll install the “hello” and “world” apps in the default namespace. These apps rely on the nodeName supplied by the Kubernetes downward API to find Linkerd. To check if your cluster supports nodeName, you can run this test job:
kubectl apply -f https://raw.githubusercontent.com/linkerd/linkerd-examples/master/k8s-daemonset/k8s/node-name-test.ymlAnd then looks at its logs:
kubectl logs node-name-testIf you see an ip, great! Go ahead and deploy the hello world app using:
kubectl apply -f https://raw.githubusercontent.com/linkerd/linkerd-examples/master/k8s-daemonset/k8s/hello-world.ymlIf instead you see a “server can’t find …” error, deploy the hello-world legacy version that relies on hostIP instead of nodeName:
kubectl apply -f https://raw.githubusercontent.com/linkerd/linkerd-examples/master/k8s-daemonset/k8s/hello-world-legacy.ymlCongrats! At this point, we have a functioning service mesh with distributed tracing enabled, and an application that makes use of it. Let’s see the entire setup in action by sending traffic through Linkerd’s outgoing router running on port 4140:
http_proxy=http://$L5D_INGRESS_LB:4140 curl -s http://hello
Hello () world ()!
Or if using hostIP:
http_proxy=http://$L5D_INGRESS_LB:If everything is working, you’ll see a “Hello world” message similar to that above, with the IPs of the pods that served the request.
STEP 4: ENJOY THE VIEW
Now it’s time to see some traces. Let’s start by looking at the trace that was emitted by the test request that we sent in the previous section. Zipkin’s UI allows you to search by “span” name, and in our case, we’re interested in spans that originated with the Linkerd router running on 0.0.0.0:4140, which is where we sent our initial request. We can search for that span as follows:
open http://$ZIPKIN_LB/?serviceName=0.0.0.0%2F4140 # on OS XThat should surface 1 trace with 8 spans, and the search results should look like this:
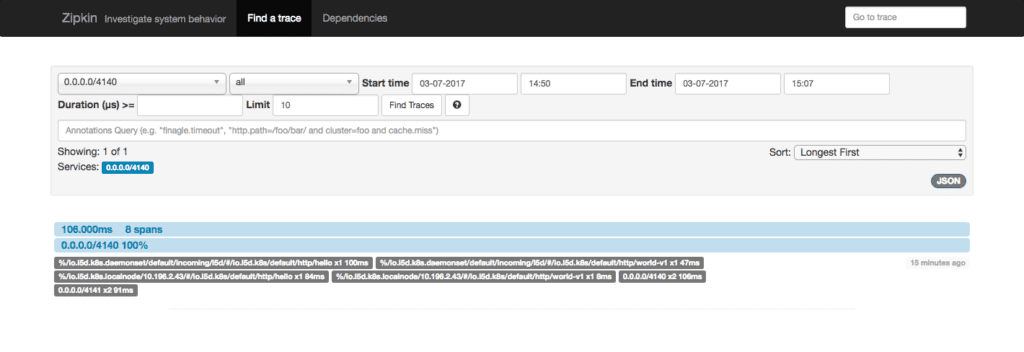
Clicking on the trace from this view will bring up the trace detail view:
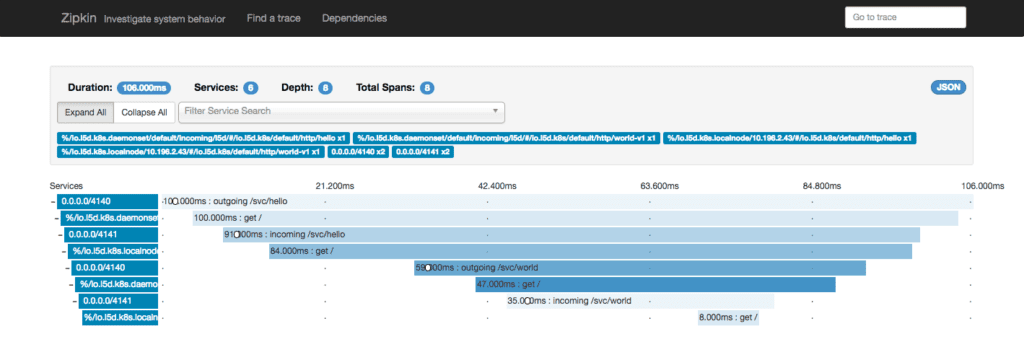
From this view, you can see the timing information for all 8 spans that Linkerd emitted for this trace. The fact that there are 8 spans for a request between 2 services stems from the service mesh configuration, in which each request passes through two Linkerd instances (so that the protocol can be upgraded or downgraded, or [TLS can be added and removed across node boundaries][part-iii]). Each Linkerd router emits both a server span and a client span, for a total of 8 spans.
Clicking on a span will bring up additional details for that span. For instance, the last span in the trace above represents how long it took the world service to respond to a request—8 milliseconds. If you click on that span, you’ll see the span detail view:
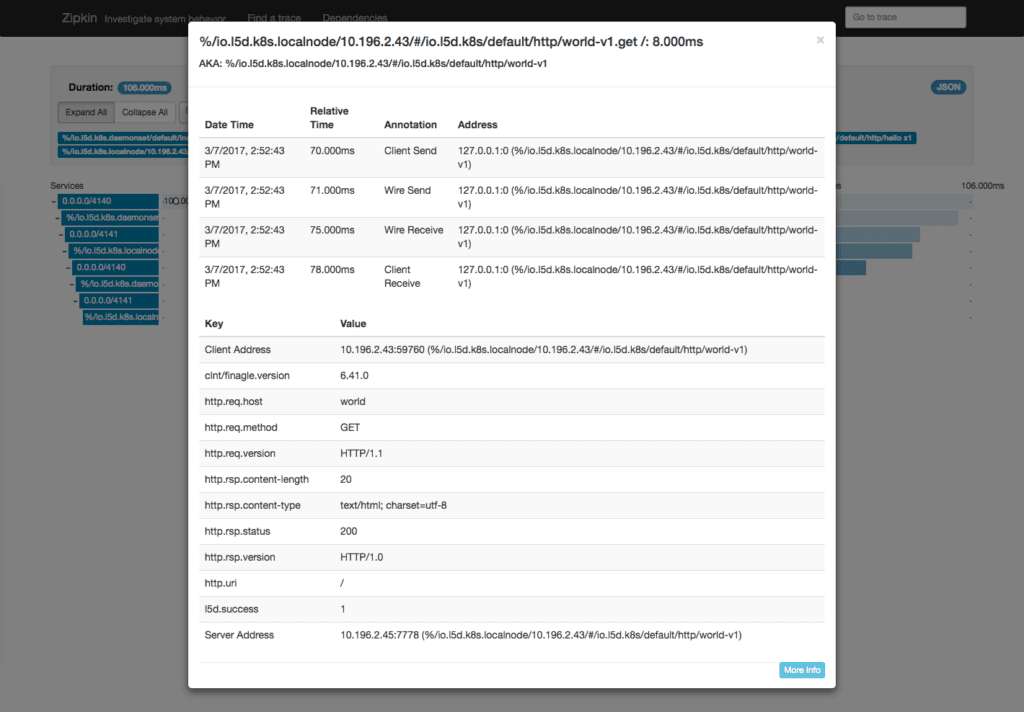
This view has a lot more information about the span. At the top of the page, you’ll see timing information that indicates when Linkerd sent the request to the service, and when it received a response. You’ll also see a number of key-value pairs with additional information about the request, such as the request URI, the response status code, and the address of the server that served the request. All of this information is populated by Linkerd automatically, and can be very useful in tracking down performance bottlenecks and failures.
A NOTE ABOUT REQUEST CONTEXT
In order for distributed traces to be properly disentangled, we need a little help from the application. Specifically, we need services to forward Linkerd’s “context headers” (anything that starts with l5d-ctx-) from incoming requests to outgoing requests. Without these headers, it’s impossible to align outgoing requests with incoming requests through a service. (The hello and world services provided above do this by default.)
There are some additional benefits to forwarding context headers, beyond tracing. From our previous blog post on the topic:
Forwarding request context for Linkerd comes with far more benefits than just tracing, too. For instance, adding the
l5d-dtabheader to an inbound request will add a dtab override to the request context. Provided you propagate request context, dtab overrides can be used to apply per-request routing overrides at any point in your stack, which is especially useful for staging ad-hoc services within the context of a production application. In the future, request context will be used to propagate overall latency budgets, which will make handling requests within distributed systems much more performant. Finally, theL5d-sampleheader can be used to adjust the tracing sample rate on a per-request basis. To guarantee that a request will be traced, setL5d-sample: 1.0. If you’re sending a barrage of requests in a loadtest that you don’t want flooding your tracing system, consider setting it to something much lower than the steady-state sample rate defined in your Linkerd config.
Conclusion
We’ve demonstrated how to run Zipkin in Kubernetes, and how to configure your Linkerd service mesh to automatically export tracing data to Zipkin. Distributed tracing is a powerful tool that is readily available to you if you’re already using Linkerd. Check out Linkerd’s Zipkin telemeter configuration reference, and find us in the Linkerd Slack if you run into any issues setting it up.
APPENDIX: UNDERSTANDING TRACES
In distributed tracing, a trace is a collection of spans that form a tree structure. Each span has a start timestamp and an end timestamp, as well as additional metadata about what occurred in that interval. The first span in a trace is called the root span. All other spans have a parent ID reference that refers to the root span or one of its descendants. There are two types of spans: server and client. In Linkerd’s context, server spans are created when a Linkerd router receives a request from an upstream client. Client spans are created when Linkerd sends that request to a downstream server. Thus the parent of a client span is always a server span. In the process of routing a multi-service request, Linkerd will emit multiple client and server spans, which are displayed as a single trace in the Zipkin UI.
For instance, consider the following trace:
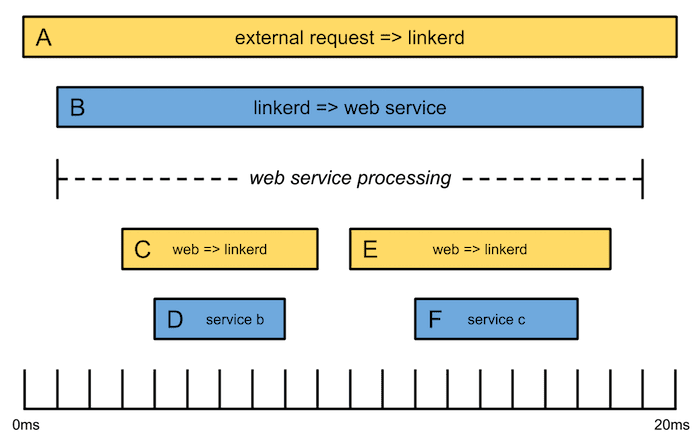
In this example, an external request is routed by Linkerd to the “Web” service, which then calls “Service B” and “Service C” sequentially (via Linkerd) before returning a response. The trace has 6 spans, and a total duration of 20 milliseconds. The 3 yellow spans are server spans, and the 3 blue spans are client spans. The *root span* is Span A, which represents the time from when Linkerd initially received the external request until it returned the response. Span A has one child, Span B, which represents the amount of time that it took for the Web service to respond to Linkerd’s forwarded request. Likewise Span D represents the amount of time that it took for Service B to respond to the request from the Web service. For more information about tracing, read our previous blog post, [Distributed Tracing for Polyglot Microservices][polyglot].
Note: there are a myriad of ways to deploy Kubernetes and different environments support different features. Learn more about deployment differences here.
[part-i]: https://deploy-preview-1532--linkerdio.netlify.app/2016/10/04/a-service-mesh-for-kubernetes-part-i-top-line-service-metrics/ [part-ii]: https://deploy-preview-1532--linkerdio.netlify.app/2016/10/14/a-service-mesh-for-kubernetes-part-ii-pods-are-great-until-theyre-not/ [part-iii]: https://deploy-preview-1532--linkerdio.netlify.app/2016/10/24/a-service-mesh-for-kubernetes-part-iii-encrypting-all-the-things/ [part-iv]: https://deploy-preview-1532--linkerdio.netlify.app/2016/11/04/a-service-mesh-for-kubernetes-part-iv-continuous-deployment-via-traffic-shifting/ [part-v]: https://deploy-preview-1532--linkerdio.netlify.app/2016/11/18/a-service-mesh-for-kubernetes-part-v-dogfood-environments-ingress-and-edge-routing/ [part-vi]: https://deploy-preview-1532--linkerdio.netlify.app/2017/01/07/a-service-mesh-for-kubernetes-part-vi-staging-microservices-without-the-tears/ [part-vii]: https://deploy-preview-1532--linkerdio.netlify.app/2017/03/14/a-service-mesh-for-kubernetes-part-vii-distributed-tracing-made-easy/ [part-viii]: https://deploy-preview-1532--linkerdio.netlify.app/2017/04/06/a-service-mesh-for-kubernetes-part-viii-linkerd-as-an-ingress-controller/ [part-ix]: https://deploy-preview-1532--linkerdio.netlify.app/2017/04/19/a-service-mesh-for-kubernetes-part-ix-grpc-for-fun-and-profit/ [part-x]: https://deploy-preview-1532--linkerdio.netlify.app/2017/05/24/a-service-mesh-for-kubernetes-part-x-the-service-mesh-api/ [part-xi]: https://deploy-preview-1532--linkerdio.netlify.app/2017/06/20/a-service-mesh-for-kubernetes-part-xi-egress/ [polyglot]: /2016/05/17/distributed-tracing-for-polyglot-microservices/

