What is a service mesh, and how is it used by cloud native apps—apps designed for the cloud? In this article, we’ll show you how to use linkerd as a service mesh on Kubernetes, and how it can capture and report top-level service metrics such as success rates, request volumes, and latencies without requiring changes to application code.
Note: This is one article in a series of articles about linkerd, Kubernetes, and service meshes. Other installments in this series include:
- Top-line service metrics (this article)
- Pods are great, until they’re not
- Encrypting all the things
- Continuous deployment via traffic shifting
- Dogfood environments, ingress, and edge routing
- Staging microservices without the tears
- Distributed tracing made easy
- Linkerd as an ingress controller
- gRPC for fun and profit
- The Service Mesh API
- Egress
- Retry budgets, deadline propagation, and failing gracefully
- Autoscaling by top-line metrics
The services must mesh
One of the most common questions we see about linkerd is, what exactly is a service mesh? And why is a service mesh a critical component of cloud native apps, when environments like Kubernetes provide primitives like service objects and load balancers?
In short, a service mesh is a layer that manages the communication between apps (or between parts of the same app, e.g. microservices). In traditional apps, this logic is built directly into the application itself: retries and timeouts, monitoring/visibility, tracing, service discovery, etc. are all hard-coded into each application.
However, as application architectures become increasingly segmented into services, moving communications logic out of the application and into the underlying infrastructure becomes increasingly important. Just as applications shouldn’t be writing their own TCP stack, they also shouldn’t be managing their own load balancing logic, or their own service discovery management, or their own retry and timeout logic. (For example, see Oliver Gould’s MesosCon talk for more about the difficulty of coordinating retries and timeouts across multiple services.)
A service mesh like linkerd provides critical features to multi-service applications running at scale:
- Baseline resilience: retry budgets, deadlines, circuit-breaking.
- Top-line service metrics: success rates, request volumes, and latencies.
- Latency and failure tolerance: Failure- and latency-aware load balancing that can route around slow or broken service instances.
- Distributed tracing a la Zipkin and OpenTracing
- Service discovery: locate destination instances.
- Protocol upgrades: wrapping cross-network communication in TLS, or converting HTTP/1.1 to HTTP/2.0.
- Routing: route requests between different versions of services, failover between clusters, etc.
In this article, we’re going to focus just on visibility: how a service mesh can automatically capture and report top-line metrics, such as success rate, for services. We’ll walk you through a quick example in Kubernetes.
Using linkerd for service monitoring in Kubernetes
One of the advantages of operating at the request layer is that the service mesh has access to protocol-level semantics of success and failure. For example, if you’re running an HTTP service, linkerd can understand the semantics of 200 versus 400 versus 500 responses and can calculate metrics like success rate automatically. (Operating at this layer becomes doubly important when we talk about retries—more on that in later articles.)
Let’s walk through a quick example of how to install linkerd on Kubernetes to automatically capture aggregated, top-line service success rates without requiring application changes.
STEP 1: INSTALL LINKERD
Install linkerd using this Kubernetes config. This will install linkerd as a DaemonSet (i.e., one instance per host) running in the default Kubernetes namespace:
kubectl apply -f https://raw.githubusercontent.com/linkerd/linkerd-examples/master/k8s-daemonset/k8s/linkerd.ymlYou can confirm that installation was successful by viewing linkerd’s admin page:
INGRESS_LB=$(kubectl get svc l5d -o jsonpath="{.status.loadBalancer.ingress[0].*}")
open http://$INGRESS_LB:9990 # on OS X
Or if external load balancer support is unavailable for the cluster, use hostIP:
HOST_IP=$(kubectl get po -l app=l5d -o jsonpath="{.items[0].status.hostIP}")
open http://$HOST_IP:$(kubectl get svc l5d -o 'jsonpath={.spec.ports[2].nodePort}') # on OS X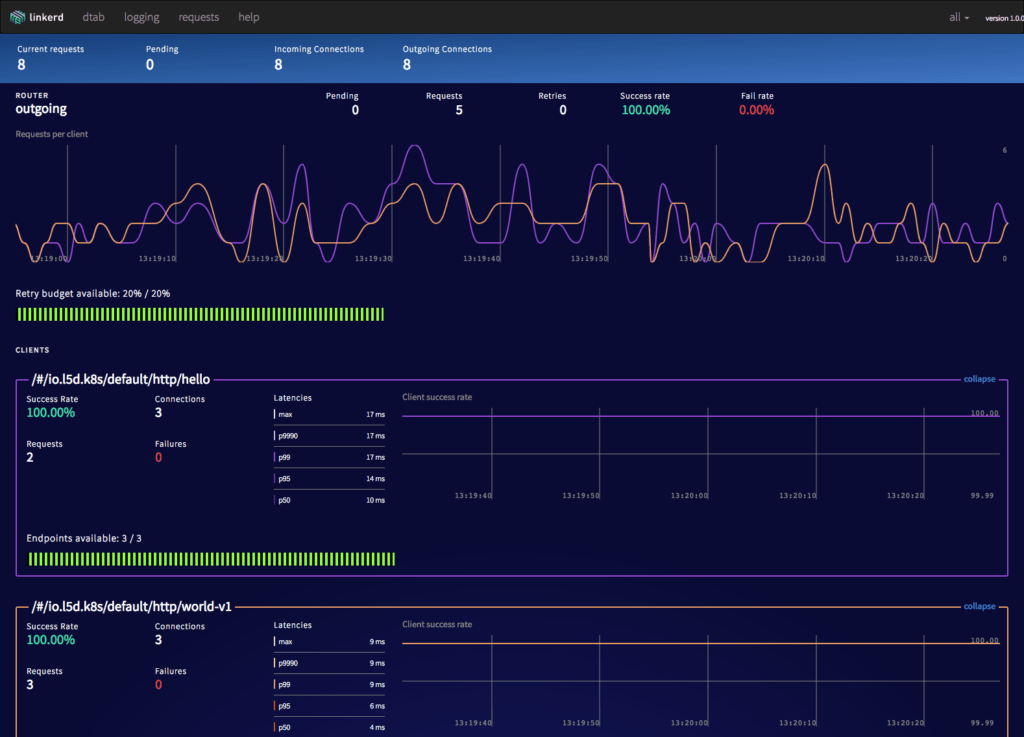
STEP 2: INSTALL THE SAMPLE APPS
Install two services, “hello” and “world”, in the default namespace. These apps rely on the nodeName supplied by the Kubernetes downward API to find Linkerd. To check if your cluster supports nodeName, you can run this test job:
kubectl apply -f https://raw.githubusercontent.com/linkerd/linkerd-examples/master/k8s-daemonset/k8s/node-name-test.ymlAnd then looks at its logs:
kubectl logs node-name-testIf you see an ip, great! Go ahead and deploy the hello world app using:
kubectl apply -f https://raw.githubusercontent.com/linkerd/linkerd-examples/master/k8s-daemonset/k8s/hello-world.ymlIf instead you see a “server can’t find …” error, deploy the hello-world legacy version that relies on hostIP instead of nodeName:
kubectl apply -f https://raw.githubusercontent.com/linkerd/linkerd-examples/master/k8s-daemonset/k8s/hello-world-legacy.ymlThese two services–“hello” and “world”–function together to make a highly scalable, “hello world” microservice (where the hello service, naturally, calls the world service to complete its request). You can see this in action by sending traffic through linkerd’s external IP:
http_proxy=$INGRESS_LB:4140
curl -s http://hello
Or to use hostIP directly:
http_proxy=$HOST_IP:$(kubectl get svc l5d -o 'jsonpath={.spec.ports[0].nodePort}')
curl -s http://hello
You should see the string “Hello world”.
STEP 3: INSTALL LINKERD-VIZ
Finally, let’s take a look at what our services are doing by installing linkerd-viz. linkerd-viz is a supplemental package that includes a simple Prometheus and Grafana setup and is configured to automatically find linkerd instances.
Install linkerd-viz using this linkerd-viz config. This will install linkerd-viz into the default namespace:
kubectl apply -f https://raw.githubusercontent.com/linkerd/linkerd-viz/main/k8s/linkerd-viz.ymlOpen linkerd-viz’s external IP to view the dashboard:
VIZ_INGRESS_LB=$(kubectl get svc linkerd-viz -o jsonpath="{.status.loadBalancer.ingress[0].*}")
open http://$VIZ_INGRESS_LB # on OS X
Or if external load balancer support is unavailable for the cluster, use hostIP:
VIZ_HOST_IP=$(kubectl get po -l name=linkerd-viz -o jsonpath="{.items[0].status.hostIP}")
open http://$VIZ_HOST_IP:$(kubectl get svc linkerd-viz -o 'jsonpath={.spec.ports[0].nodePort}') # on OS X
You should see a dashboard, including selectors by service and instance. All charts respond to these service and instance selectors:
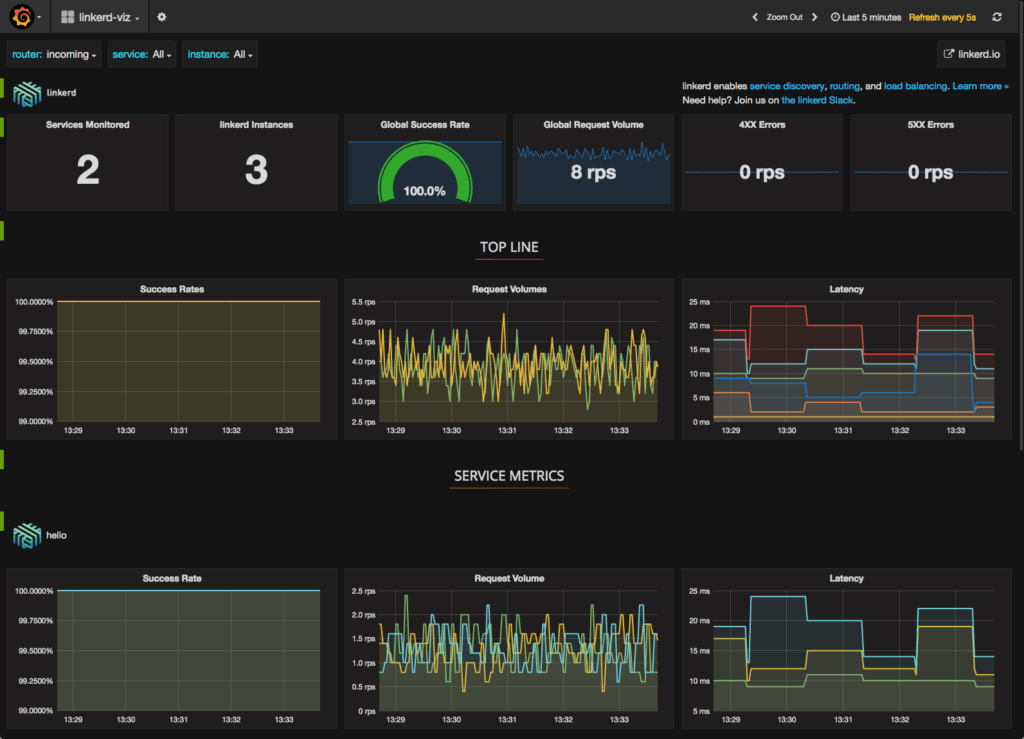
The linkerd-viz dashboard includes three sections:
- TOP LINE: Cluster-wide success rate and request volume.
- SERVICE METRICS: One section for each application deployed. Includes success rate, request volume, and latency.
- PER-INSTANCE METRICS: Success rate, request volume, and latency for each node in your cluster.
That’s all
With just three simple commands we were able to install linkerd on our Kubernetes cluster, install an app, and use linkerd to gain visibility into the health of the app’s services. Of course, linkerd is providing much more than visibility: under the hood, we’ve enabled latency-aware load balancing, automatic retries and circuit breaking, distributed tracing, and more. In upcoming posts in this series, we’ll walk through how to take advantage of all these features.
In the meantime, for more details about running linkerd in Kubernetes, visit the Kubernetes Getting Started Guide or hop in the linkerd slack and say hi!
Stay tuned for Part II in this series: Pods Are Great Until They’re Not.