Distributed tracing is a critical tool for debugging and understanding microservices. But setting up tracing libraries across all services can be costly—especially in systems composed of services written in disparate languages and frameworks.
In this post, we’ll show you how you can easily add distributed tracing to your polyglot system by combining Linkerd, our open source service mesh for cloud-native applications, withZipkin, a popular open source distributed tracing framework. Why distributed tracing? As companies move from monolithic to multi-service architectures, existing techniques for debugging and profiling begin to break down. Previously, troubleshooting could be accomplished by isolating a single instance of the monolith and reproducing the problem. With microservices, this approach is no longer feasible, because no single service provides a complete picture of the performance or correctness of the application as a whole. We need new tools to help us manage the real complexity of operating distributed systems at scale.
Distributed tracing is one such tool. With distributed tracing, we can track requests as they pass through multiple services, emitting timing and other metadata throughout, and this information can then be reassembled to provide a complete picture of the application’s behavior at runtime. Distributed tracing has been called the “the most wanted and missed tool in the microservice world”.
One popular implementation of distributed tracing is Zipkin, an open-source project that provides tools for both collecting and analyzing trace data. Applications integrate with Zipkin by reporting request timing data to a Zipkin collector process. This data is stored to a persistent backend and aggregated into traces, which is queried through Zipkin’s query interface or displayed in its web UI.
Here’s an example trace in the Zipkin UI:
As you can see, Zipkin traces afford us a comprehensive view of runtime application behavior, allowing us to answer questions such as:
- Which parts of my system are slow?
- Which call patterns can be optimized with parallelization?
- Which calls are redundant?
Zipkin has been used at scale, and boasts tracing libraries for many languages and runtimes. However, there are cases where adding a library to an existing service can be costly, or where maintaining feature and performance parity across a wide set of languages can be restrictive.
Enter Linkerd, our open source, industrial-strength *service mesh* for cloud-native apps. There are many reasons to use Linkerd, but in this case, we can take advantage of the fact that, since Linkerd is handling your service-to-service HTTP or RPC calls for you, it’s also in the perfect position to automatically add instrumentation and emit tracing data on your behalf—*without* requiring Zipkin libraries per service.
In fact, since Linkerd is built on top Finagle, Twitter’s open source, high volume RPC library, Linkerd features Zipkin support that has actually been tested at scale!
In the the rest of this article, we’ll walk you through the process of generating Zipkin traces from Linkerd.
SETUP
For the purpose of this article, we’re going to run a suite of Zipkin services locally, side-by-side with a Linkerd process. This setup works for demonstration, but it’s much more realistic that in production you’ll have hundreds of Linkerd processes all writing timing data to a centralized Zipkin cluster.
The easiest way to run Zipkin locally is to use the docker-zipkin project, which also requires that you have docker-compose installed. Clone the repo, and start Zipkin:
git clone https://github.com/openzipkin/docker-zipkin.git
cd docker-zipkin
docker-compose up
Next let’s create an example linkerd.yaml config file that includes the Zipkin tracer config. For instance:
admin:
  port: 9990

telemetry:
  - kind: io.l5d.zipkin
    host:
    port: 9410
    sampleRate: 1.0

routers:
  - protocol: http
    label: router1
    dtab: /svc => /$/inet/127.1/9001
    servers:
      - port: 9000
  - protocol: http
    label: router2
    dtab: /svc => /$/inet/127.1/9002
    servers:
      - port: 9001
  - protocol: http
    label: router3
    dtab: /svc => /$/inet/127.1/9990
    servers:
      - port: 9002
To send data to Zipkin, we use the io.l5d.zipkin telemeter. Found in the telemeterssection of the config above, this tells the Linkerd process that it should generate and emit tracing data. The host and port config options indicate where the zipkin-collector process is running (be sure to set the host to match the docker IP where you started docker-zipkin in the previous step). The sampleRate config option determines what percentage of requests will be traced. Typically that number would be set much lower, but for the purpose of demonstration we are tracing 100% of requests.
It’s also worth pointing out that the routers section of the config file above is contrived in order to make our example requests somewhat more interesting. It defines three routers listening on three different ports. The router on port 9000 forwards to the router on port 9001, which forwards to the router on port 9002, which forwards to the Linkerd admin service on port 9990. There is absolutely no good reason for you to configure Linkerd this way in production, but we use it now to simulate three service hops and demonstrate tracing capabilities. For more information on configuring Linkerd, check out our Configuration Guide.
Once you’ve created the config, you can run it using the Linkerd executable that’s available for download from the Linkerd Github releases page. For this example, we’ll use the executable from the most recent release: linkerd-0.9.0-exec. Start Linkerd with the config file that you created:
$ ./linkerd-0.9.0-exec linkerd.yaml
...
I 0511 18:14:47.496 THREAD1: Serving admin http on 9990
I 0511 18:14:47.613 THREAD1: serving router1 on localhost/127.0.0.1:9000
I 0511 18:14:47.627 THREAD1: serving router2 on localhost/127.0.0.1:9001
I 0511 18:14:47.632 THREAD1: serving router3 on localhost/127.0.0.1:9002
TRACING
Now that Linkerd and Zipkin are up and running, let’s use the configured routers to send a request to Linkerd’s admin/ping endpoint:
$ time curl :9000/admin/ping
pong
real 0m0.028s
user 0m0.004s
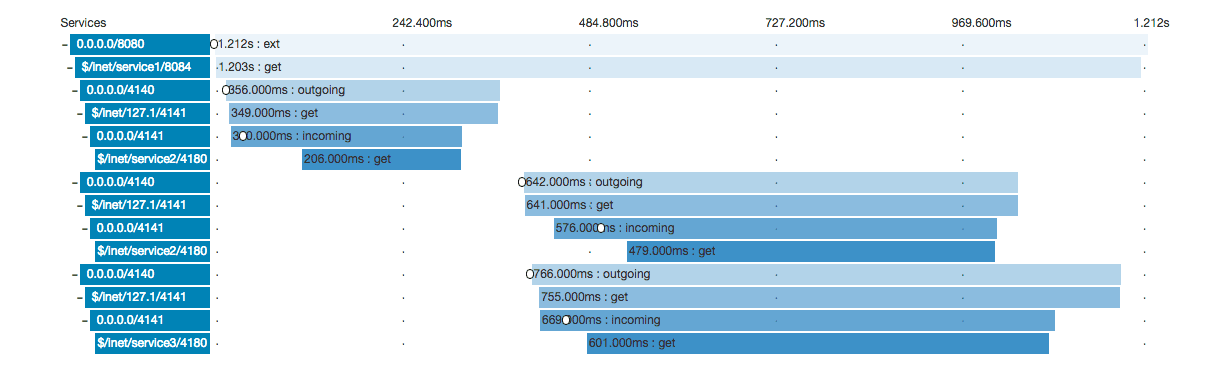
sys 0m0.004sHuh. 28 milliseconds to receive a 4-byte response. That seems suspicious. Can we get some additional information about how the latency for that request breaks down? Sure we can. Let’s visit the Zipkin web UI, which is running on port 9411 in your docker machine. When the UI loads, select 127.0.0.1/9000 from the service dropdown menu, and click Find Traces. Select a trace, and then click Expand All. You’ll see something like:
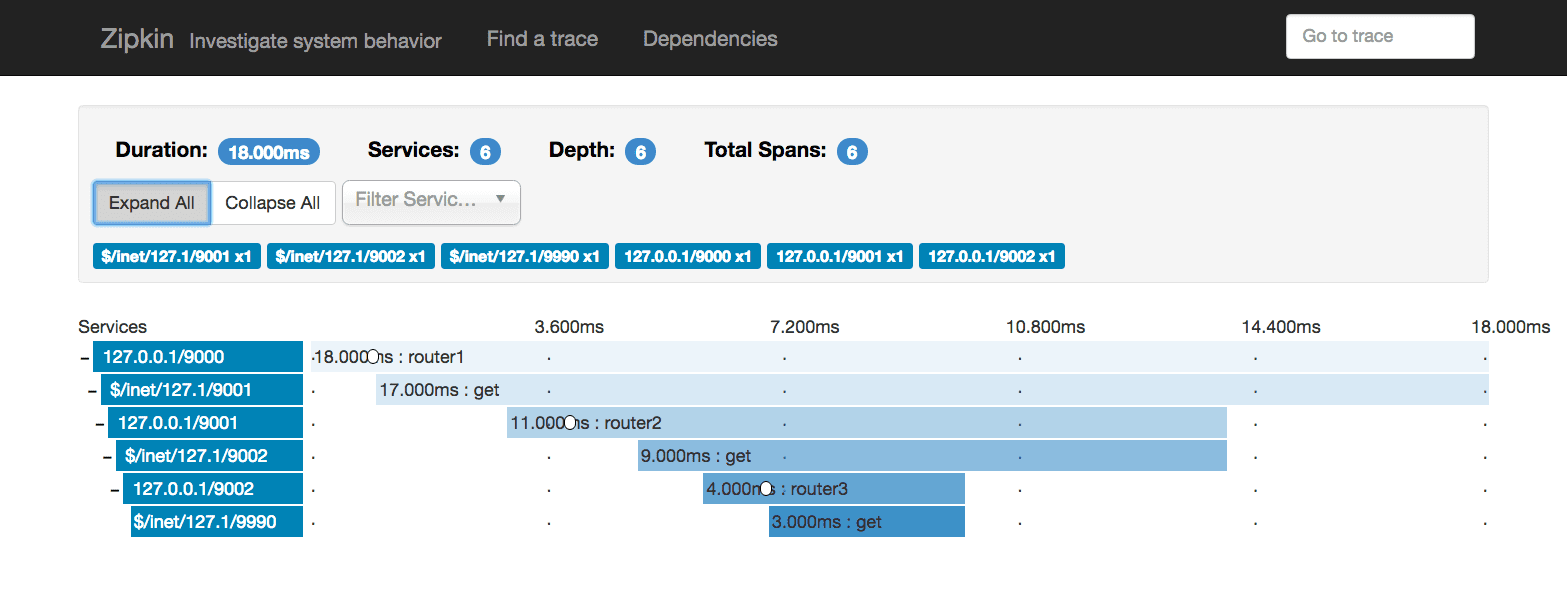
This trace shows multiple spans. The top-most span shows router1 receiving the initial request. This span represents the point at which the request entered our system, from which it took us 18 milliseconds to respond (the other 10 milliseconds can be attributed to curl establishing its own HTTP connection). The next span shows router1 making a request to router2, the third span shows router2 receiving the request from router1, and so on. The very last span shows the actual request from router3 to the admin interface. The length of the bars shows that each subsequent network request adds a few milliseconds of latency. The actual admin endpoint that we asked for only took 3 milliseconds to respond.
If you click on the last span in the trace, you can see details about that span, which look something like:
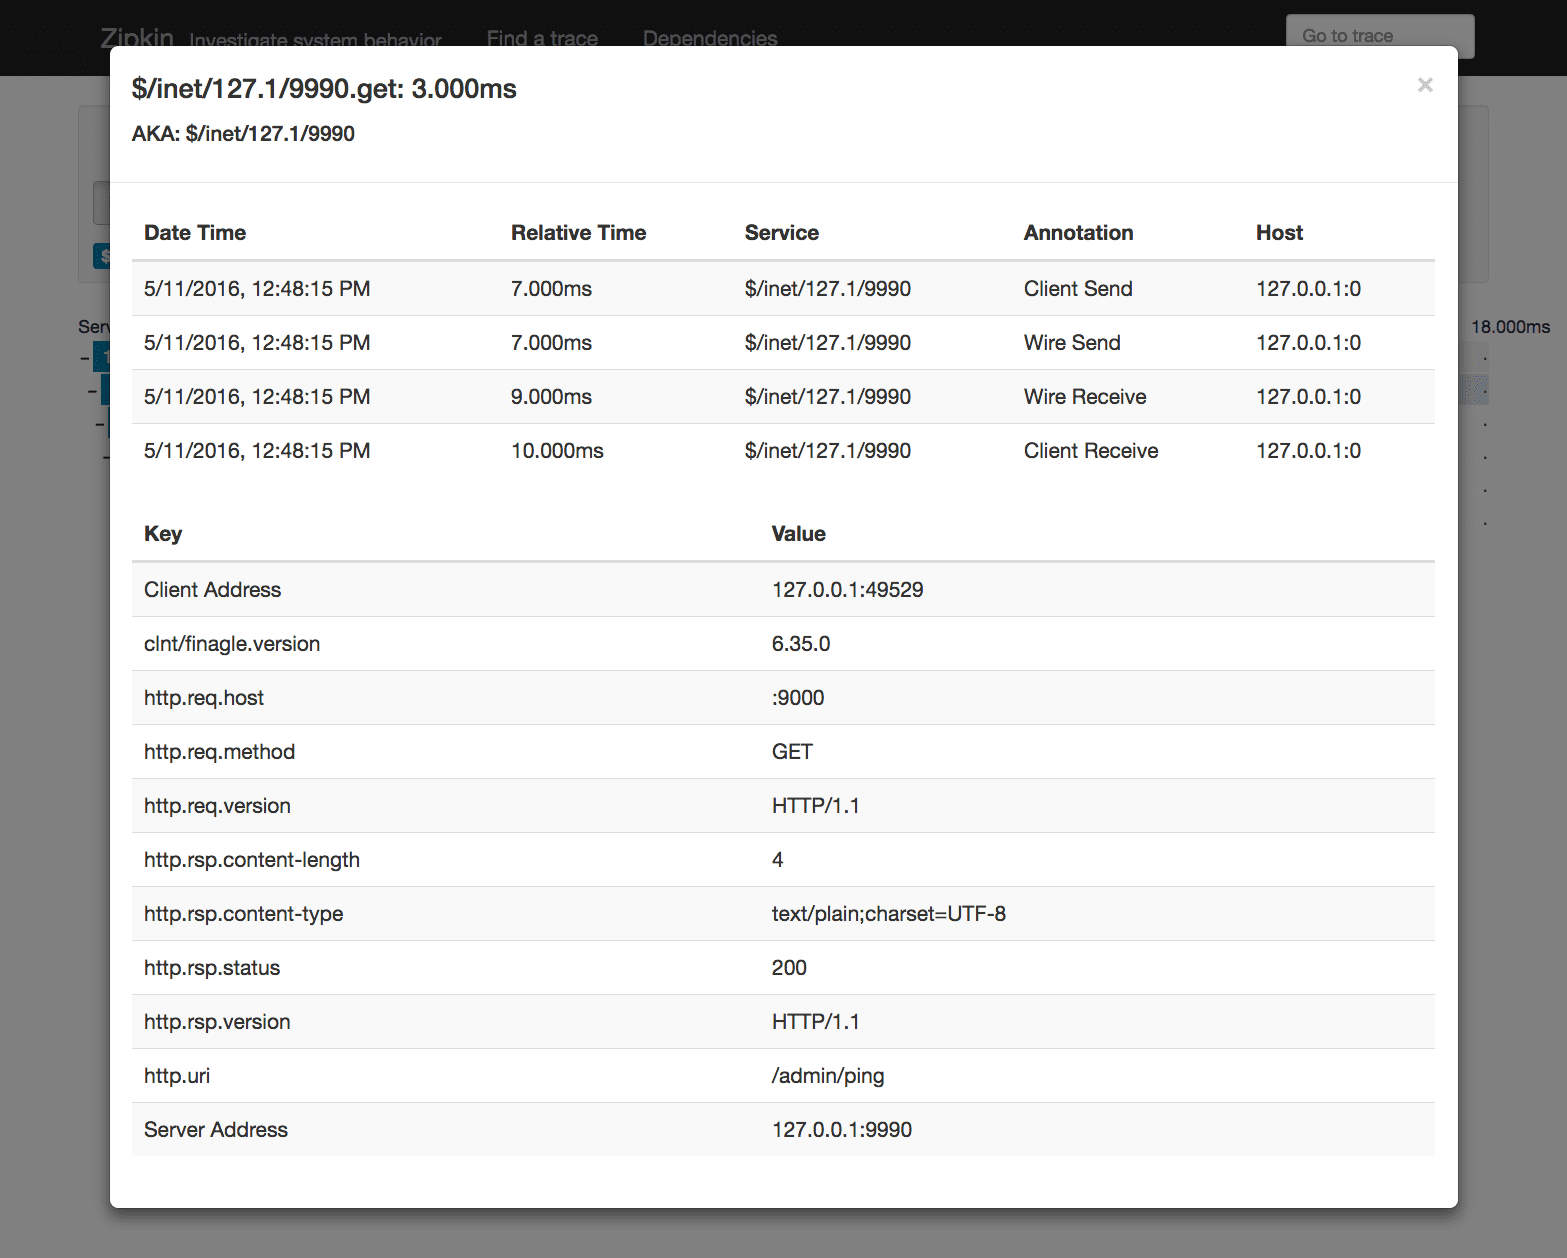
This shows information like the response status code (200) and the response body content length (4 bytes) and content type (text). It also shows specific timing info for the request. The Client Send annotation is the time at which the router instructed its finagle-http client to send the request, whereas the Wire Send annotation represents the time at which the request was actually sent. Wire Receive and Client Receive have similar semantics. In this case, the observed amount of time that it took for the admin server to respond to our request is only 2 milliseconds. This is a good demonstration of how latency is incurred by introducing multiple hops into the system, even in the best-case scenario. You can imagine what happens in large systems where network queueing, garbage collection, and resource contention introduce further sources of delay. Hence the value of distributed tracing!
It’s especially important to note that the admin server is not instrumented to emit timing data to Zipkin. Simply by using the Linkerd service mesh to route our requests, we’re able to gain valuable insights into how our services are performing without adding additional instrumentation to the services themselves.
REQUEST CONTEXT
While we at Buoyant like to describe all of the additional tracing data that Linkerd provides as “magic telemetry sprinkles for microservices”, the reality is that we need a small amount of request context to wire the traces together. That request context is established when Linkerd receives a request, and, for HTTP requests, it is passed via HTTP headers when Linkerd proxies the request to your application. In order for your application to preserve request context, it needs to include, without modification, all of the inbound l5d-ctx-* HTTP headers on any outbound requests that it makes. As an example, check out this Ruby plugin that handles all header forwarding for a web service built with Sinatra and ActiveResource.
Forwarding request context for Linkerd comes with far more benefits than just tracing, too. For instance, adding the l5d-dtab header to an inbound request will add a dtab override to the request context. Provided you propagate request context, dtab overrides can be used to apply per-request routing overrides at any point in your stack, which is especially useful for staging ad-hoc services within the context of a production application. In the future, request context will be used to propagate overalllatency budgets, which will make handling requests within distributed systems much more performant.
Finally, the L5d-sample header can be used to adjust the tracing sample rate on a per-request basis. To guarantee that a request will be traced, set L5d-sample: 1.0. If you’re sending a barrage of requests in a loadtest that you don’t want flooding your tracing system, consider setting it to something much lower than the steady-state sample rate defined in your Linkerd config.
TRYING IT OUT YOURSELF
We’ve described how to use Linkerd to automatically generate Zipkin traces from service-to-service HTTP or RPC calls without having to add Zipkin libraries into application code. By using the techniques above, applications that use Linkerd can get Zipkin traces with minimal effort. If you’re interested in trying this out, we’re always happy to help folks use Linkerd in new and exciting ways. Check out Linkerd’s tracing documentation, and hop into the Linkerd Slack and say hello.